#256 Data modelling 6.6 min
Star Schema from Scratch: Facts, Dimensions and Grain
Nine order lines, one fact table, three reports, and every report adds up to 64.
Predict the build and reports
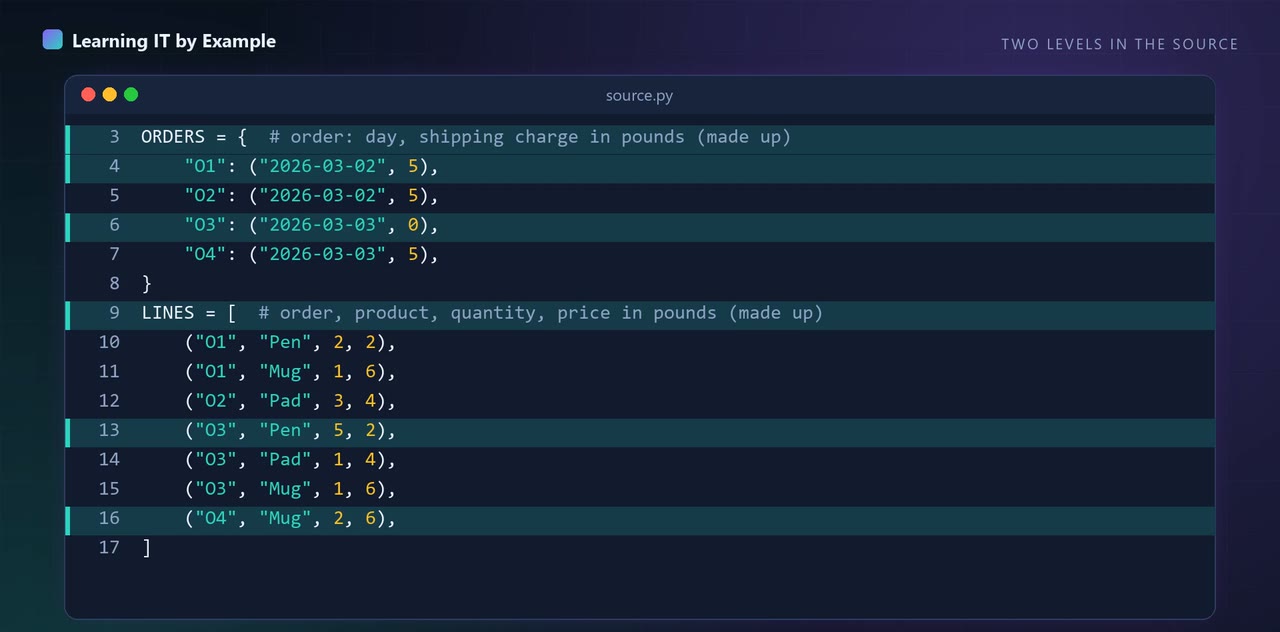
Copy the code folder first. Read source.py and star.py, then write down the row counts and the two totals you expect from python run.py build, and the month totals from python run.py reports. Run both and compare. You should see 9 fact rows and 64 in both totals.
A hint
Each fact row is quantity times the product price.
Add an order in March
In source.py, add one more line to LINES: ("O7", "2026-03-10", "c2", "p1", 3). Predict the new row counts and totals, then run python run.py build and python run.py reports. You should see 7 date rows, 10 fact rows, and 70 for both totals, and a 2026-03 value of 6 in the monthly report. Remove the added line again afterwards, because the next task expects the original nine lines.
A hint
Three pens at 2 pounds each is 6.
Write a sales by product report
In reports.py, add a fourth report called sales by product. Join fact_sales to dim_product, group by p.name, order by p.name, and sum f.amount, following the pattern of the category report. Run python run.py reports. You should see Mug 24, Pad 24, Pen 16, which adds up to 64.
A hint
Copy the sales by category entry and change the column you group by.
Break the grain
In source.py, add a repeat of the first line to LINES: ("O1", "2026-01-05", "c1", "p1", 2). Predict what happens, then run python run.py build. The script should stop with sqlite3.IntegrityError: UNIQUE constraint failed: fact_sales.order_id, fact_sales.product_key. Remove the line afterwards.
A hint
The fact table key is the order and the product together.
These tasks are for you to try on your own machine. Nothing is checked or saved.
What this does not show
Nine made-up order lines in SQLite; it does not measure speed or cover slowly changing dimensions.
Up next in Data modelling
More in Data modelling
- #110 Slowly Changing Dimensions in SQL: Type 1 vs Type 2
- #130 Define a Metric Once: Views and a Metrics Layer
- #250 Data Modelling Basics: Entities, Keys, Relationships
- #252 Normalisation 1NF to 3NF on a Messy Spreadsheet
- #253 Primary Keys: Natural, Surrogate and Hash Keys
- #254 Constraints That Catch Bad Data: PK, FK, CHECK