#199 Machine learning and data science 6.3 min
Confidence Intervals by Simulation: Bootstrap vs Formula
A 95% bootstrap interval from 10 made-up values caught the true mean 863 times in 1000.
A bigger sample of deliveries
Copy the code folder first. In run.py, in the one function, change draw_sample(population, 20, rng) to draw_sample(population, 100, rng). Before you run, predict whether both 95% intervals will get wider or narrower. Then run python run.py one and compare the t formula and bootstrap lines with the video.
A hint
The standard error is the sample standard deviation divided by the square root of n.
Too few resamples
In run.py, in the one function, add the line rng = np.random.default_rng(7) just before the bootstrap line, and change bootstrap_interval(x, rng) to bootstrap_interval(x, rng, resamples=50). Run python run.py one, then change 7 to 8 and 9. The printed text still says 10000 resamples; ignore it. Predict whether the bootstrap ends move more than they would with 10000 resamples.
A hint
The t formula line should stay the same each time, because the sample does not change.
Aim for an 80% interval
In run.py, in the cover function, change t_interval(x) to t_interval(x, 0.8) and bootstrap_interval(x, rng, resamples=2000) to bootstrap_interval(x, rng, resamples=2000, level=0.8). Predict whether the counts will sit near 950 or near 800, then run python run.py cover. It may take up to a minute.
A hint
Compare the counts for samples of 10, 40 and 160 with the video's 95% counts.
Evenly spread delivery times
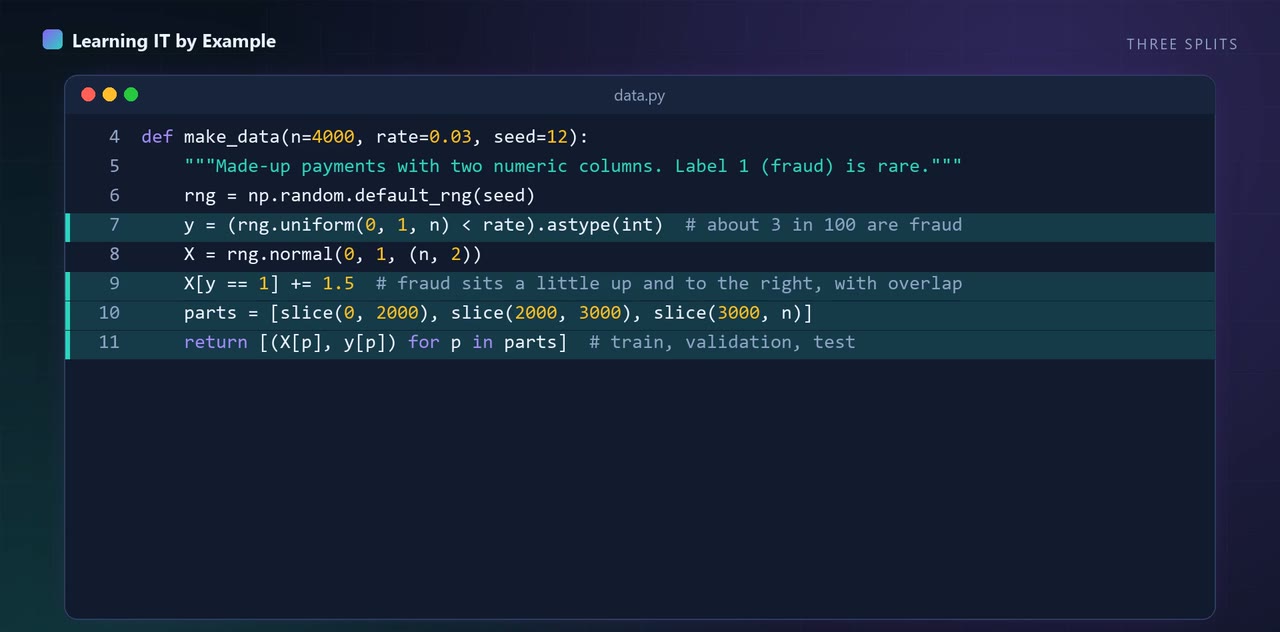
In data.py change rng.geometric(1 / 15, n) to rng.integers(1, 30, n), so delivery times are evenly spread with no rare very long waits (you may also change the comment to match). Predict whether the bootstrap count for samples of 10 gets closer to 950 or further from it than 863, then run python run.py cover (about 40 seconds) and compare both columns. When I ran it, samples of 10 gave t formula 952 and bootstrap 912 of 1000, and samples of 160 gave 938 and 931.
A hint
The video's reading of the run is that 10 rows rarely include the rare long waits. With evenly spread times there are no rare long waits to miss.
These tasks are for you to try on your own machine. Nothing is checked or saved.
What this does not show
Made-up skewed data, 1000 tries per sample size, and only the plain percentile bootstrap (no BCa).
Up next in Machine learning and data science
More in Machine learning and data science
- #182 Linear Regression From Scratch, Then scikit-learn
- #183 Precision, Recall, F1: Which Metric Matters?
- #184 Overfitting You Can See: Train vs Validation Error
- #185 Cross-Validation Done Right: The Leakage Mistake
- #186 Data Leakage: The Bug That Fakes Accuracy, Reproduced
- #187 Feature Engineering Beat 500 Trees, on Made-Up Data
Related videos
- #182 Linear Regression From Scratch, Then scikit-learn Machine learning and data science
- #296 Attention in 40 Lines of NumPy: The Core of Transformers LLM engineering and evals
- #184 Overfitting You Can See: Train vs Validation Error Machine learning and data science
- #186 Data Leakage: The Bug That Fakes Accuracy, Reproduced Machine learning and data science