#149 Python for data 6.4 min
Missing Data in pandas: Drop, Fill or Model It?
On made-up data, dropping rows moved a mean from 40,057 to 37,458; a model on age got back to 39,972.
Predict the dropped-rows mean
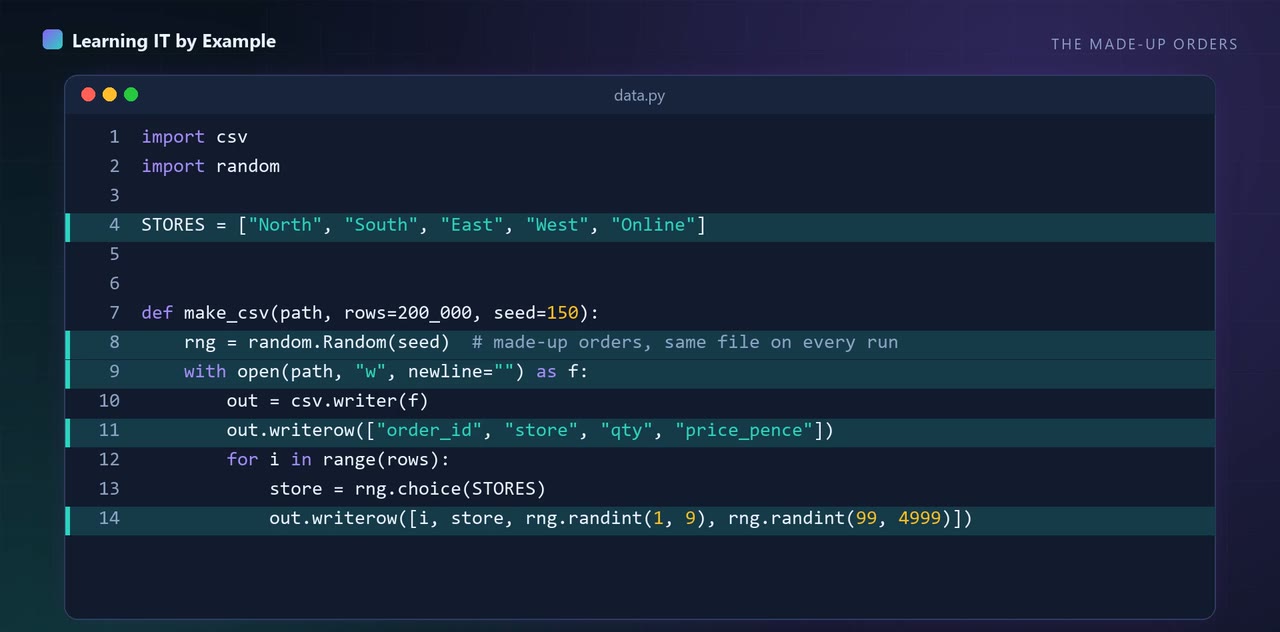
Copy the code folder first. Read data.py and fixes.py. Before running anything, predict for each of the words mcar, mar and mnar whether the drop rows mean will be close to the true mean of 40,057 or clearly below it, and say why. Then run python run.py mcar, python run.py mar and python run.py mnar, and compare the drop rows line with your predictions.
A hint
Ask which people are more likely to lose their income, and whether they earn more or less than average.
Predict how many gaps appear
In data.py change the 0.3 in the mcar branch of hide to 0.5. Before running, predict roughly how many of the 1,000 incomes will be reported missing, and what will happen to the spread on the fill mean line. Then run python run.py mcar and compare.
A hint
The first printed line shows the missing count. The spread is the standard deviation column.
Fill with the median
In fixes.py change fill_mean so it fills with df["income"].median() instead of the mean. Predict whether the spread on the fill mean line will still shrink compared with the true line, then run python run.py mcar and look at the spread column.
A hint
Think about what happens to the spread when about 30 percent of the rows all get the same single number.
Compare rows with and without gaps
The video's tip is to compare rows with gaps and rows without, on something you did observe. In run.py, after holed is made, add lines that print the mean age of the rows where income is missing and the mean age of the rows where it is present, using holed["income"].isna(). Predict which of mcar, mar and mnar will show a clear difference, then run all three words.
A hint
Use a name such as gap = holed["income"].isna(), then holed[gap]["age"].mean() and holed[~gap]["age"].mean().
These tasks are for you to try on your own machine. Nothing is checked or saved.
What this does not show
Made-up data where the true answer and the reason for each gap are known by design; one simple model, filled once, and no multiple imputation.
Up next in Python for data
More in Python for data
- #08 Pandas vs Polars vs DuckDB on 10M Rows, Timed and Checked
- #09 Clean Messy Data with Pandas 3: End to End, 3 Mistakes
- #137 Polars for pandas Users: One Report, Translated
- #138 Seven pandas Changes Tested on 1M Rows: Speed and Memory
- #139 Validate Data with Pydantic: Catch Bad Rows
- #140 Python Dates and Time Zones: 5 Bugs Reproduced
Related videos
- #151 Regex for Data Cleaning: Extract IDs and Phones in Python Python for data
- #325 Parse a Messy CSV Live: Interview Round in Python Forward deployed engineer interviews
- #137 Polars for pandas Users: One Report, Translated Python for data
- #138 Seven pandas Changes Tested on 1M Rows: Speed and Memory Python for data